Course Description & Curriculum
The Data Analysis with R online course consists of video lectures, an eBook and an R project to complete exercises, as well as 3 live sessions to provide personal instruction.
The course will run for approximately 1,5 – 2 weeks, depending on how the live sessions have been scheduled. The course is divided into three phases:
You’ll granted access to the online course content about 1 week prior to our first scheduled group session. During this period you should review the course material and practice with the exercises. We suggest the you set aside at least 1 hour a day for learning. You can cover the content on Day 6 & Day 7 after Live Session #1
The following chapters are included in the eBook. Not all sections are explicitly discussed during the live group sessions.
Getting Started
Fundamentals I
Longer Case Study
Fundamentals II
The Tidyverse Review
Additional Case Studies I
Additional Topics
Appendix
There are two 2-hour group sessions. We’ll cover some of the basics but I’ll also challenge you to apply your knowledge to some new exercises. Be sure to complete the exercises.
1st Live Session
Break period
2nd Live Session
Each participant will have a 30-minute 1:1 call with the instructor.
Break period
3rd Live Session – 1:1 Mentoring
Yes! If you’ve never programmed before, R’s learning curve is very comfortable. Here are some reasons why you don’t need to worry.
I’m amazed by how quickly course participants progress from complete beginners to working on their own data.
What do you think code this does? I bet you can explain this pretty easily.
> xx <- c(6,7,3,2,7,7,8)
> mean(xx)
[1] 5.714286
We won’t cover the what & why parts of statistics. You should know what you want to do to your data and why you’re doing it before coming to class. That’s literally your job as the researcher and domain expert. My job as the instructor is to show you how to do it in R.
If you want to brush up on your statistic knowledge, watch out for the Statistical Literacy course at your institute.
There are two opinions here and both are acceptable. I’ll let you decide what is appropriate for your skill and interest level.
Skill first, data second
This says you should develop the skills to handle data before you start collecting it. I completely agree with this. Actually, designing experiments is already performing statistics, i.e. data collection. Storing, naming and backing up your data are all crucial decisions in your data analysis workflow that can have severe consequence later on. So, knowing how you’ll work with your data in R before you even begin your project will help you out a lot. Bringing relevant data from a colleague (or even your own M.Sc.) would be an acceptable alternative to not brining any data. Bringing in no data at all is not recommended!
The downside is that by the time you actually collect your own data your skills have have gotten rusty, and you may lack the motivation to learn when it’s not for your own data.
Data first, skills second
This says that analysing your own data, with the genuine interest you have as the researcher, is incredibly motivating. You just don’t get the same motivation working on generic case studies or a colleague’s data as you do with working on your own. The 1:1 mentoring session can also be extremely beneficial at this stage.
The downside here is that your work may be unnecessarily difficult because of poor design choices you made because you didn’t know R.
As an absolute beginner, I want to build up your confidence. Ironically, that’s why it’s important to not get too ambitious too quickly. If you set your goals too high and don’t achieve them, you may become frustrated & discouraged enough to revert back to your old habits and give up on R altogether.
Also, don’t underestimate the difficulty and complexity of small data sets. If you’re not comfortable with R, they are a good training ground to improve your skills. We’ll work with some “play” data, and simulating “fake” data is a common strategy that allows you to learn before working on real, large and messy data.
You’ll get to more advanced analytics eventually, but it’s a progression that you’ll undergo at your own pace. So, if you feel comfortable or you have prior knowledge of R and are motivated, then go ahead and try out some BioConductor packages for bioinformatics.
Yes! Nonetheless, working with multiple files can pose challenges and you may want to stick with a single file if it’s possible.
NB. Almost every “Can R do this?” question is going to be answered with a “Yes!“. How exactly, and whether it’s a good idea, are different stories. But that’s what this class is for.


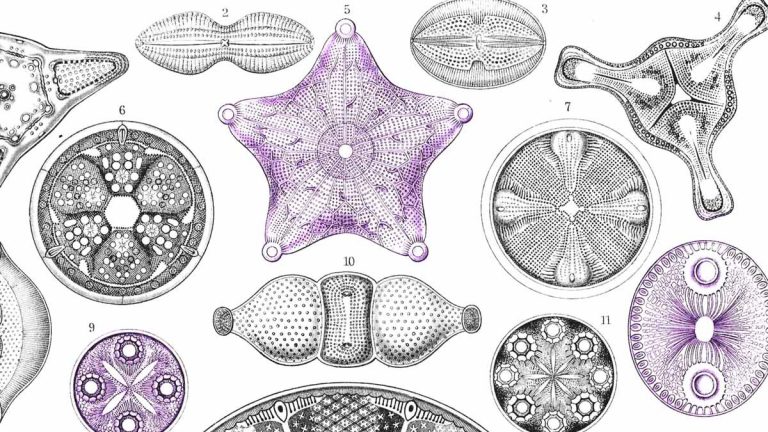
Kunstformen:
Inspiration for our artwork
The drawings used throughout our website come from Ernst Haeckel’s Kunstformen der Natur, published between 1899 and 1904.
As an accomplished German naturalist and artist, Haeckel was already familiar to Rick Scavetta from his studies in Evolutionary Biology. When developing the company’s visual identity, Rick was drawn to these images for a number of reasons.
Kunstformen der Natur is one of the most influential works bridging the gap between science and art. This is reflected in the marriage of the hard and soft skills in every workshop, such as the presentation of difficult technical material in the Presentation Skills workshop.